模板
title: ""
graphType: default
dateRangeValue: 10
dateRangeType: LATEST_MONTH
startOfWeek: 1
showCellRuleIndicators: false
titleStyle:
  textAlign: left
  fontSize: 22px
  fontWeight: normal
dataSource:
  type: PAGE
  value: ''
  dateField:
    type: FILE_MTIME
  filters: []
fillTheScreen: false
enableMainContainerShadow: false
cellStyleRules:
  - id: default_b
    color: "#0d4429ff"
    min: 1
    max: "3"
  - id: default_c
    color: "#1c753cff"
    min: "3"
    max: 5
  - id: default_d
    color: "#26a641ff"
    min: 5
    max: "20"
  - id: default_e
    color: "#3ad353ff"
    min: "20"
    max: 999
mainContainerStyle: {}
cellStyle:
  minWidth: 13px
  minHeight: 13px
title: ""
graphType: month-track
dateRangeValue: 3
dateRangeType: LATEST_MONTH
startOfWeek: 1
showCellRuleIndicators: false
titleStyle:
  textAlign: left
  fontSize: 22px
  fontWeight: normal
dataSource:
  type: PAGE
  value: ""
  dateField:
    type: FILE_MTIME
  filters: []
fillTheScreen: false
enableMainContainerShadow: false
cellStyleRules:
  - id: default_b
    color: "#0d4429ff"
    min: 1
    max: "3"
  - id: default_c
    color: "#1c753cff"
    min: "3"
    max: 5
  - id: default_d
    color: "#26a641ff"
    min: 5
    max: "20"
  - id: default_e
    color: "#3ad353ff"
    min: "20"
    max: 999
mainContainerStyle: {}
cellStyle:
  minWidth: 13px
  minHeight: 13px
English | 中文文档
What
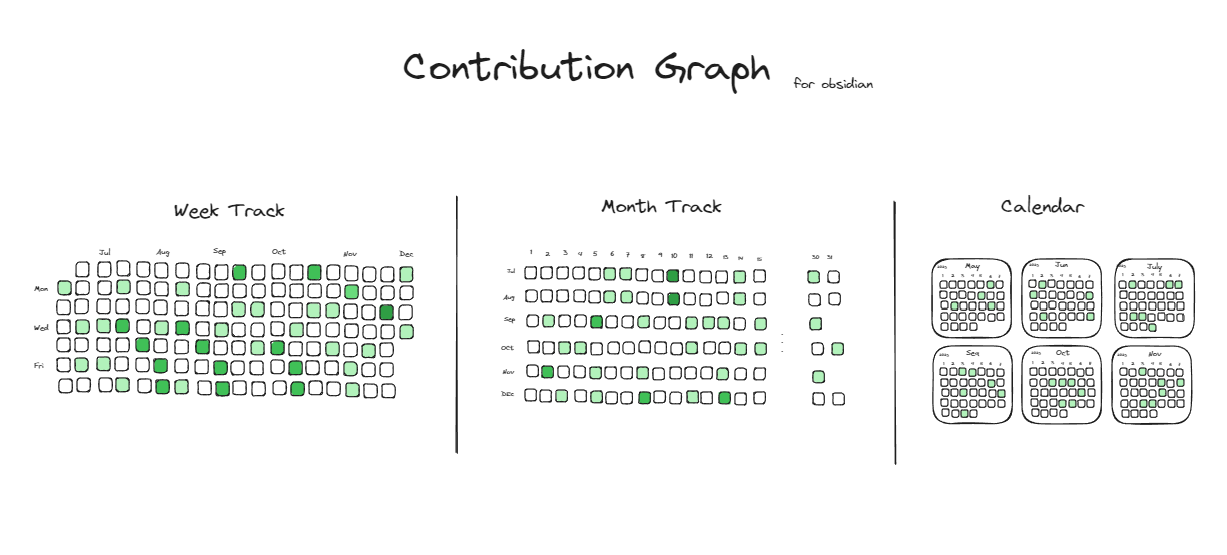
Contribution Graph is a plugin for obsidian.md which could generate interactive heatmap graphs like GitHub to track your notes, habits, activity, history, and so on.

Use cases
- Habit Tracker: Count the number of tasks you complete every day. Different numbers will be marked in different colors.
- Note Tracker: Count the number of note you create every day. Different numbers will be marked in different colors.
- Review Report: Count your notes or tasks for a certain period of time and generate a heat map for a more intuitive review
- and more…
Quick Start
- create empty note, then right-click
- select Add Heatmap options
- click the
savebutton, and then a heatmap will be created in note.
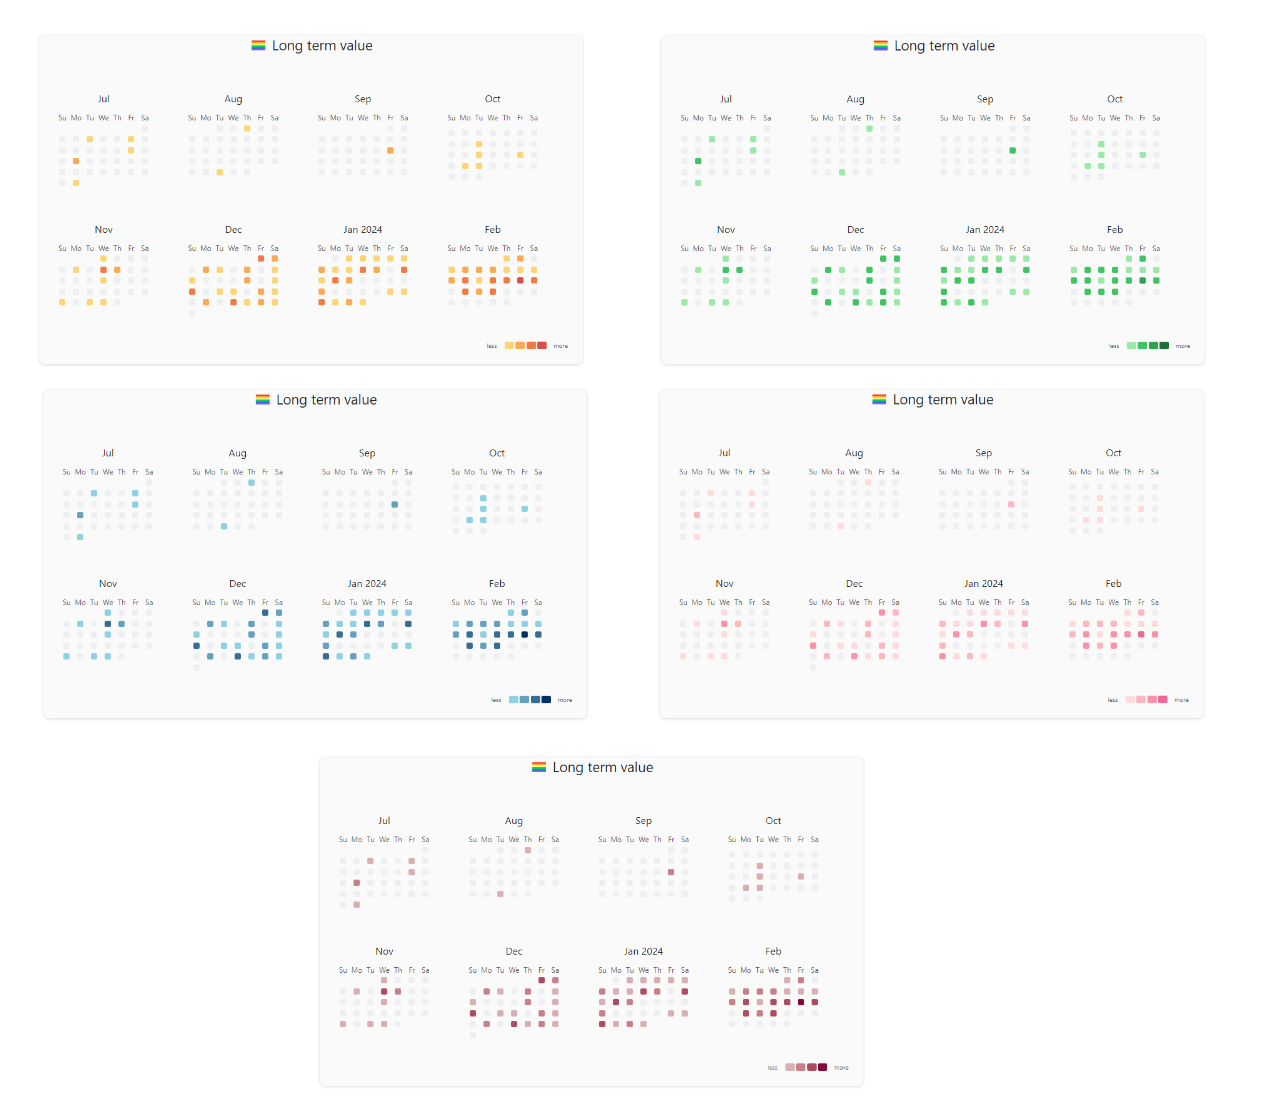
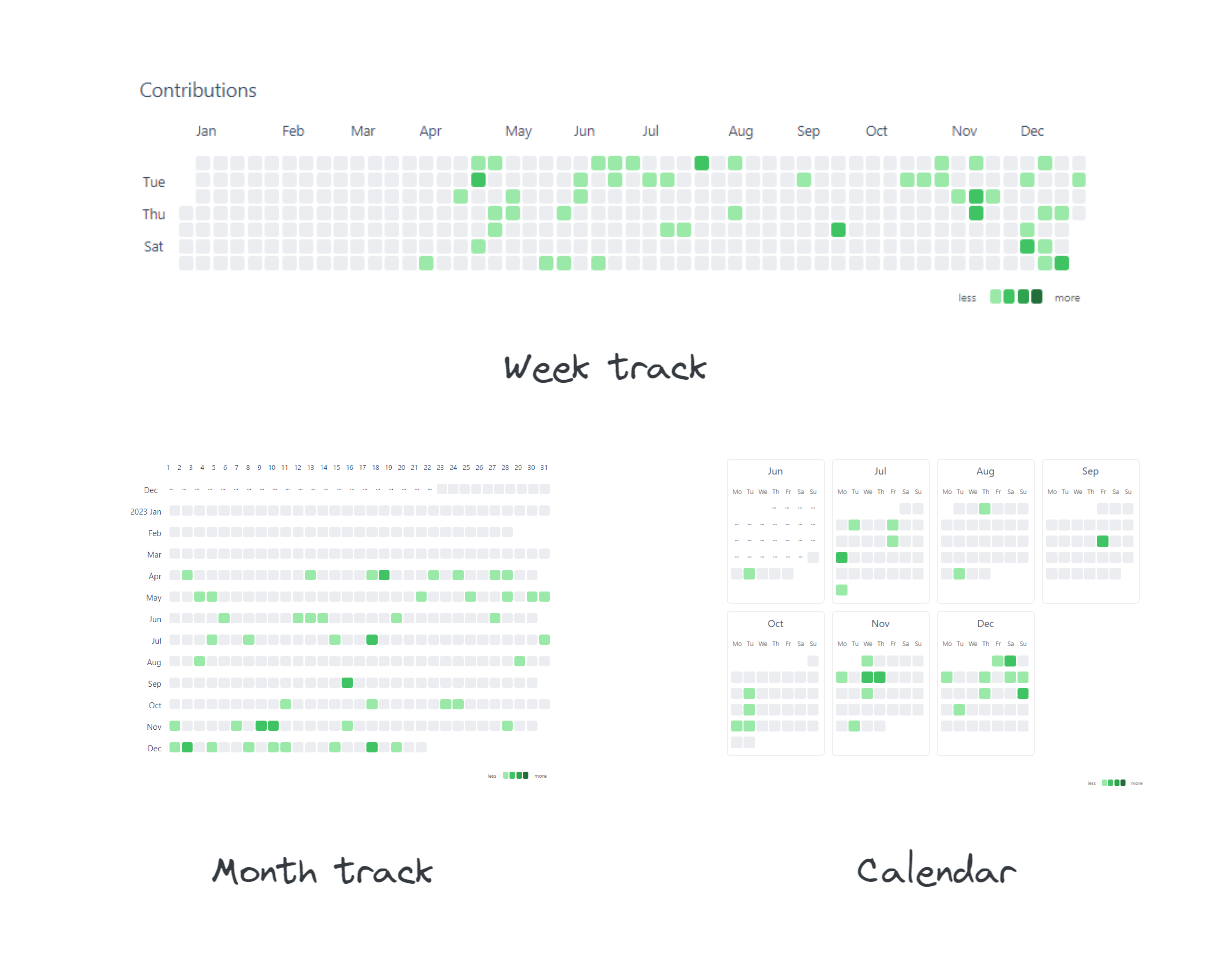
Theme
- Git Style
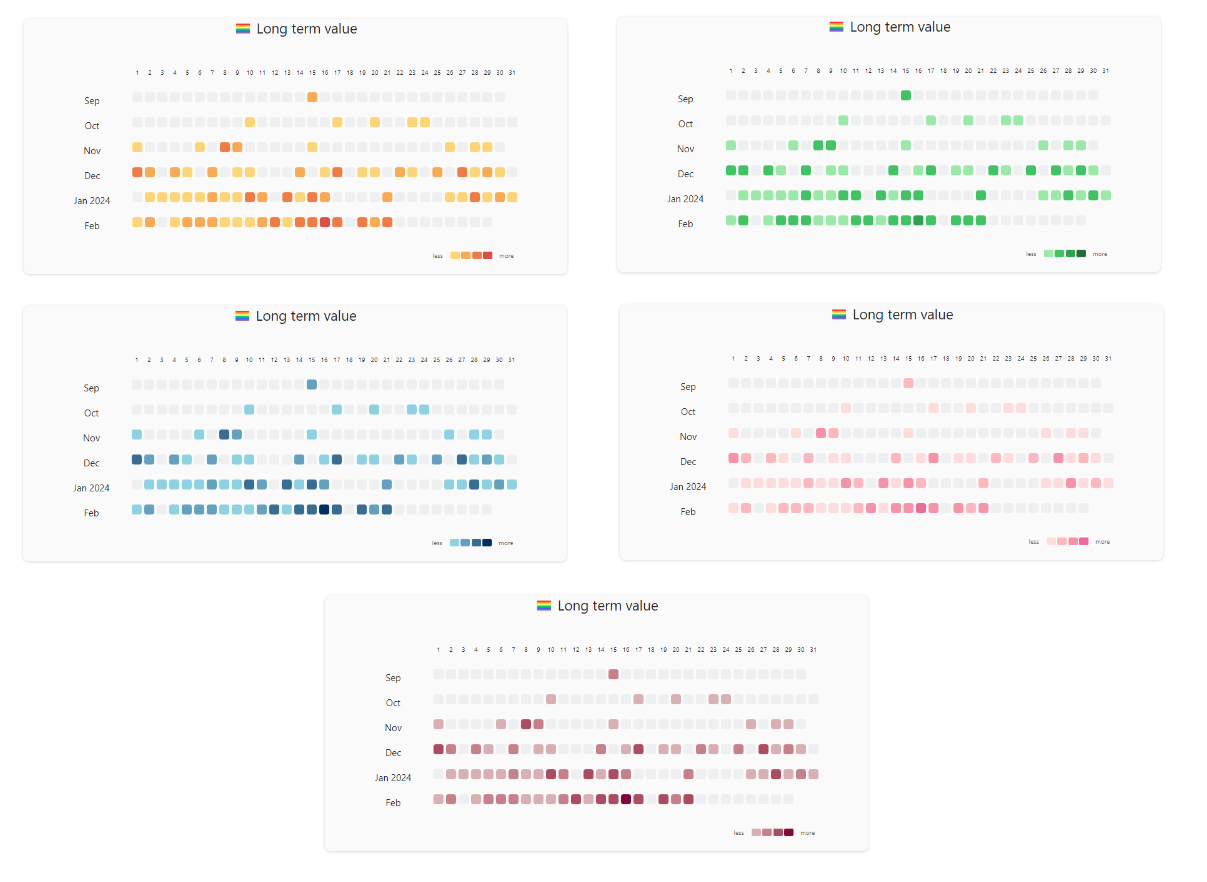
- Month Track
- Calendar
Features
- diverse views, support week-track(default), month-track, and calendar view.
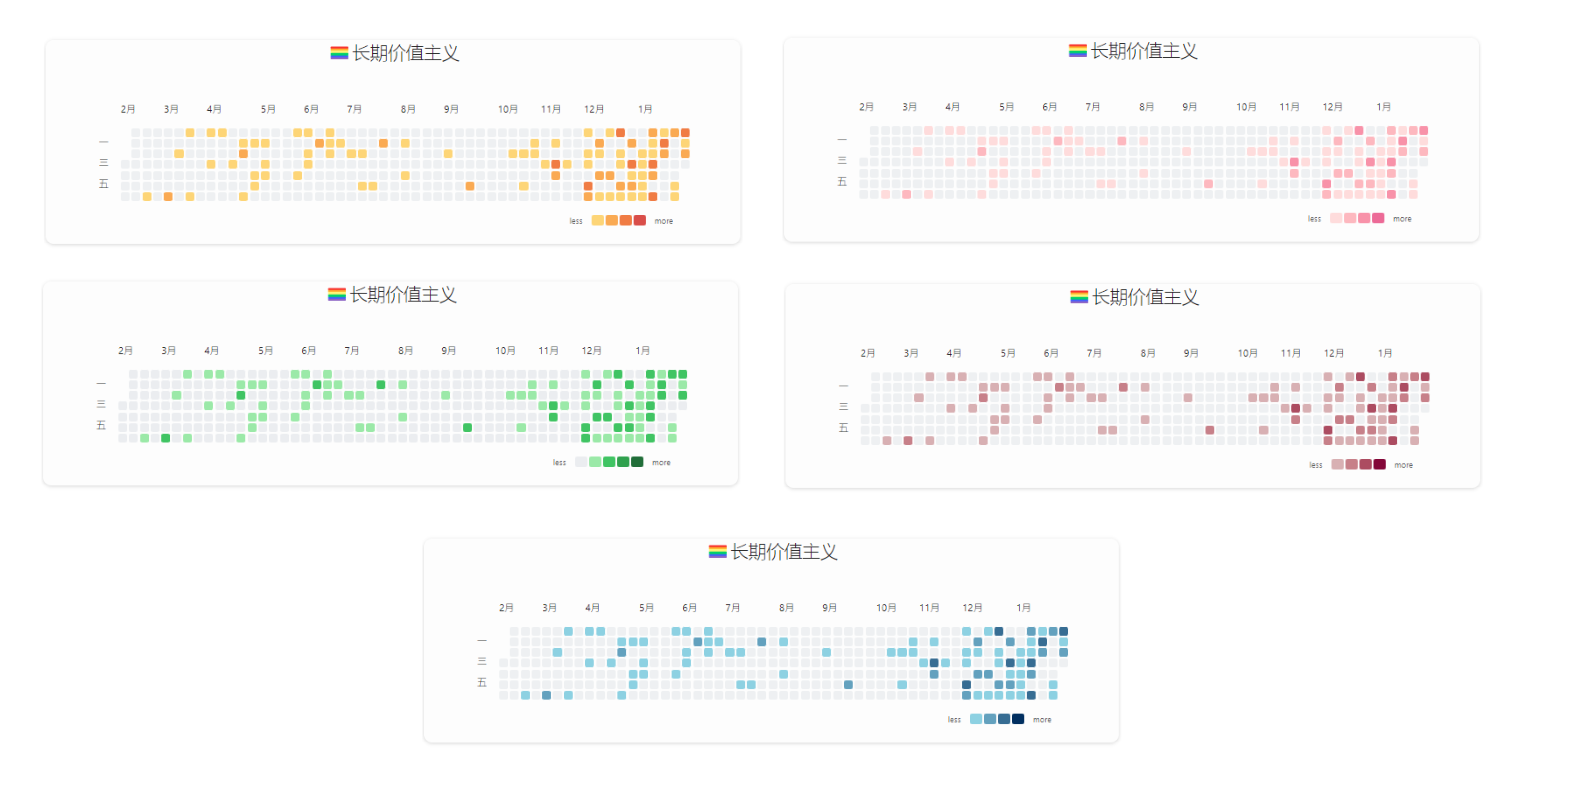
- personalized style, you can configure different cell colors and fill cells with emojis.
- use fixed date range or latest date to generate graph
- interactive charts, you can customize cell click event, hover to show statistic data
- simply integrate with DataviewJS, use contribution graph’s api to dynamically render charts
How to modify graph?
Jut click the edit button at top right corner
Configurations
| name | description | type | default | sample | required |
|---|---|---|---|---|---|
| title | the title of the graph | string | Contributions | false | |
| titleStyle | the style of the title | object | false | ||
| days | Maximum number of days for the chart to display (starting from today) | number | 365 | true if miss fromDate and toDate | |
| fromDate | The start date of the chart | date, format yyyy-MM-dd | 2023-01-01 | true if miss days | |
| toDate | The end date of the chart | date, format yyyy-MM-dd | 2023-12-31 | true if miss days | |
| query | dataview query syntax, contribution graph will use it to count files | string | true | ||
| dateField | Date attributes of files used for data distribution | string | file.ctime | createTime | false |
| startOfWeek | start of week | number | 0 | false | |
| showCellRuleIndicators | Control the display and hiding of cell rule indicator elements | boolean | true | false | |
| cellStyleRules | cell style rule | array | false |