实验内容简介
在图中通过按度排序和投票算法选择两组重要节点组,并通过 SIR 模型评价这两种方法的效果
- 对给定的网络,采用邻接表建立网络
- 采用度选择策略和基于投票的策略选出一组重要节点的算法设计及实现
- 试验对比,分析不同初始种子节点数量情况下,两种方法的感染规模对比;不同感染率 情况下,两种方法的对比
算法说明
1. 按度排序(Degree-based Selection)
按度排序是一种基于网络中每个节点的度(即节点的连接数)来进行选择的策略。度高的节点被认为是网络中的“中心”节点,这些节点与其他节点的连接较多,因而具有较高的传播潜力。
原理:
- 度(Degree) 是指一个节点的连接数,即它有多少个邻居节点。
- 按度排序的基本假设是,度越高的节点传播信息或病毒的能力越强,因为它们与更多的节点相连,容易将传播从一个节点扩展到多个节点。
- 因此,选择度高的节点作为初始传染节点,通常能启动更广泛的传播。
过程:
- 计算每个节点的度。
- 将节点按度从高到低排序。
- 选出排名前
num个节点作为初始传播节点。
2. Vote Rank 排序(Vote Rank-based Selection)
Vote Rank 是一种基于投票机制的排序方法,旨在避免选择高度集中的节点,防止初始节点聚集在某些区域,而是尽量让选出的节点分布得更广,从而有可能带来更广泛的传播效果。
核心原理
-
投票机制的基本思想:
- 每个节点根据其与邻居节点的连接关系(即边)分配一定的投票权重。
- 投票权重通常与节点的度(degree,连接的边数)相关,节点的度越高,其传播潜力越大,投票能力也越强。
- 在每次迭代中,节点会将投票权分配给邻居节点,影响邻居节点的得票数。
-
抑制集中现象:
- 一旦某个节点被选为传播源,它周围邻居节点的投票能力会被削弱或清零,避免其邻居继续成为传播源。
- 这种削弱机制会引导算法倾向于选择分布更均匀的节点作为传播源。
3. SIR 传播模型
SIR(Susceptible-Infected-Recovered)模型是流行病学中常用的传染病传播模型,通常用于模拟病毒在网络中的传播过程。在这个实验中,SIR 模型用来评估不同初始节点选择策略的传播效果。
模型说明:
- S(易感染):节点初始时是健康的,容易被感染。
- I(感染):节点感染了病毒,可以传播病毒。
- R(痊愈):节点被感染后痊愈,不能再被感染。
过程:
- 从选出的初始节点开始,按照一定的传播规则(如每个感染节点将其邻居节点感染)进行传播。
- 传播过程持续直到网络中的节点全部感染或传播结束。
- 统计感染的节点数量,比较两种策略下的传播效果。
比较:
- 按度排序:可能导致传播的“集中”效应,传播的速度较快,但可能会导致某些区域过度传播,导致传播范围受限。
- Vote Rank 排序:通过投票机制避免节点聚集,传播可能更加均匀,能够覆盖到更多的区域。
算法分析与设计
按度排序
- 邻接表存储的情况下直接按照邻接表的长度进行排序输出前 n 个数据就可以了
def get_top_nodes_by_degree(graph: Graph, num: int) -> list[str]:
    return sorted(graph.get_nodes(), key=lambda x: graph.get_neighbors_count(x), reverse=True)[:num]
按投票排序
- 先初始化每个节点的投票能力(这里置 1)
- 计算抑制因子
- 这里采用优化算法(只更新到邻居的邻居)避免整个图重新计算
- 先把第一次投票投了
- 然后进行 num 次循环,在每次循环中对最高的节点分数置 0,能力置 0,因为能力的置 0 导致的周围邻居要更新分数;邻居的能力收到抑制,邻居的邻居的分数更新(顺序要从外向内)
def get_top_nodes_by_vote(graph: Graph, num: int = 100) -> list[str]:
    global vote_result
    if len(vote_result) < num:
        vote_result.clear()
        res = []
        # init the vote ability of each node
        vote_ability = {}
        for node in graph.get_nodes():
            # the vote ability of each node is 1
            vote_ability[node] = 1
        # calc the supress factor
        k = 1/graph.get_everage_degree()
        # init the vote score of each node
        vote_score = {}
        for node in graph.get_nodes():
            vote_score[node] = 0
            for neighbor in graph.get_neighbors(node):
                vote_score[node] += vote_ability[neighbor]
        # select the top num nodes, update vote ability and vote score
        for i in tqdm(range(num), desc="Selecting top nodes by vote"):
            if len(vote_score) == 0:
                break
            top_node = max(vote_score, key=vote_score.get)
            res.append(top_node)
            vote_score.pop(top_node)
            # update neighbors' vote score
            for neighbor in graph.get_neighbors(top_node):
                if neighbor in vote_score:
                    vote_score[neighbor] -= vote_ability[top_node]
            vote_ability[top_node] = 0
            for neighbor in graph.get_neighbors(top_node):
                max_supress = max(-vote_ability[neighbor], -k)
                vote_ability[neighbor] += max_supress
                for neighbor_neighbor in graph.get_neighbors(neighbor):
                    if neighbor_neighbor in vote_score:
                        vote_score[neighbor_neighbor] += max_supress
        vote_result = res
    return vote_result[:num]
SIR 评分
- 通过 set 统计循环中各个节点的状态
- 每轮循环中对 I 中的节点的邻居有一定机会()的放入 I 中,对于 R 中的有一定机会 放入 R 中(这里写死为 1 了)
- 最后统计 R 和 I 中的总节点个数
def sir_simulation(graph: Graph, infected_nodes: list[str], beta: float, gamma: float = 1) -> int:
    # init the set of susceptible nodes, infected nodes and recovered nodes
    susceptible_nodes = set(graph.get_nodes())
    infected_nodes = set(infected_nodes)
    recovered_nodes = set()
    # remove the infected nodes from the susceptible nodes
    for node in infected_nodes:
        susceptible_nodes.remove(node)
    # simulation
    flag = True
    while flag:
        flag = False
        new_infected_nodes = set()
        new_recovered_nodes = set()
        for node in infected_nodes:
            # spread the virus
            for neighbor in graph.get_neighbors(node):
                if neighbor in susceptible_nodes and random.uniform(0, 1) < beta:
                    flag = True
                    new_infected_nodes.add(neighbor)
                    susceptible_nodes.remove(neighbor)
            # recover from the virus
            if random.uniform(0, 1) < gamma:
                new_recovered_nodes.add(node)
                flag = True
        # update the status of nodes
        infected_nodes.update(new_infected_nodes)
        infected_nodes.difference_update(new_recovered_nodes)
        recovered_nodes.update(new_recovered_nodes)
    return len(recovered_nodes) + len(infected_nodes)
统计方式
采用对每组不同的 topnode_num 和 beta 进行 9 轮模拟取中位数,减少极端情况产生的严重误差
采用线程池的操作多线程优化模拟速度
with ThreadPoolExecutor() as executor:
	futures = []
	for top_nodenum in tqdm(top_nodenum_values, desc="Top Node Num Loop"):
		for beta in tqdm(beta_values, desc="Beta Loop", leave=False):
			top_nodes_by_degree = get_top_nodes_by_degree(
				graph, top_nodenum)
			top_nodes_by_vote = get_top_nodes_by_vote(graph, top_nodenum)
			futures.append(executor.submit(
				run_simulation, graph, top_nodes_by_degree, top_nodes_by_vote, beta, top_nodenum))

	for future in tqdm(as_completed(futures), total=len(futures), desc="Simulation Progress"):
		top_nodenum, beta, (infected_nodes_by_degree,
							infected_nodes_by_vote) = future.result()
		result = {
			"top_nodenum": top_nodenum,
			"beta": beta,
			"infected_nodes_by_degree": infected_nodes_by_degree,
			"infected_nodes_by_vote": infected_nodes_by_vote
		}
		results.append(result)
测试结果
测试集来自 Stanford Large Network Dataset Collection https://snap.stanford.edu/data/
实验数据保存至 simulation_result.json 中
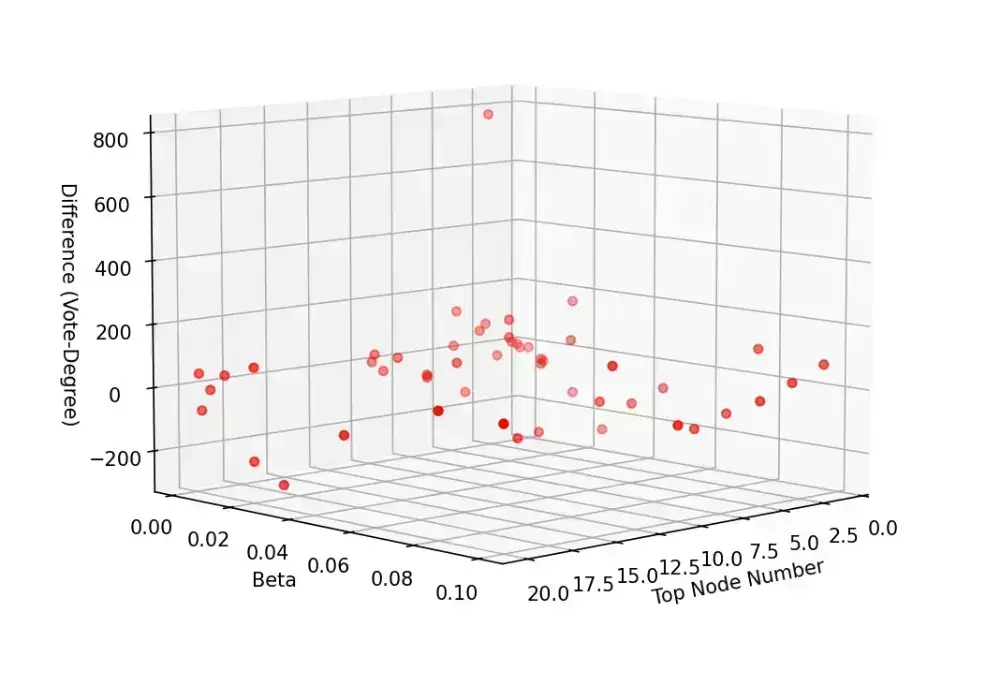
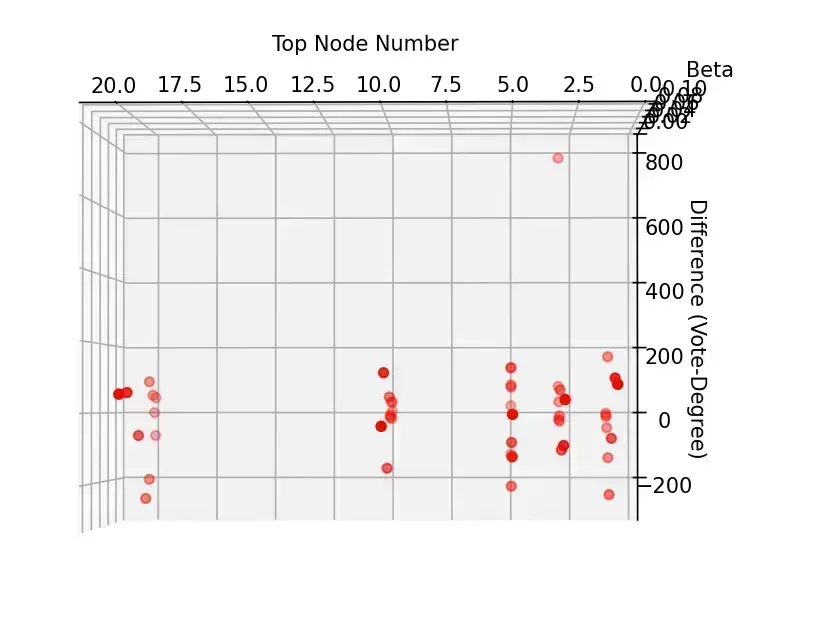
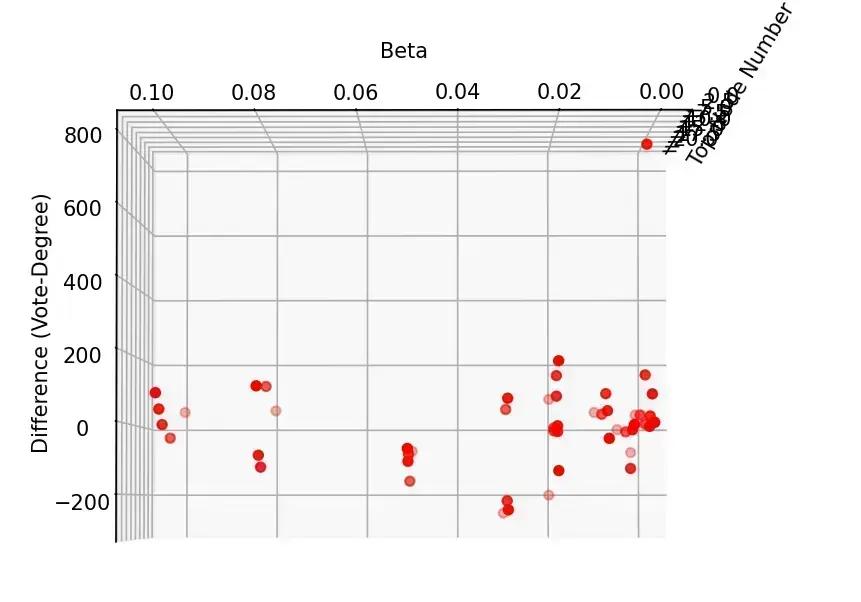

分析与探讨
- 从整体来看,投票排序的结果大体上要优于简单的按度排序
- 固定 的情况下,初始节点的总数变大,两者的差异逐渐缩小。这是合理的,因为当选取的节点足够多的时候,分散开来优化的节点总数占比会减小,投票排序的优势会缩小,此时 SIR 模型的不稳定因素起主导作用
- 固定选取数的情况下,在治愈率为 1 的时候,随着 减小,投票选举优势逐渐明显, 较大的时候,反而是简单的按度排序效果更优。这也是合理的,因为感染率低的时候需要最开始的时候能够存活并扩散开来,投票排序此时有更大优势;感染率高的时候,感染的速度成为关键,因此重合的高度数节点有更大的优势
附录:源代码
全部见 https://github.com/Satar07/node_finder
import json
import random
from graph import Graph
from tqdm import tqdm
from concurrent.futures import ThreadPoolExecutor, as_completed


def get_graph(file_name: str) -> Graph:
    graph = Graph()
    with open(file_name, "r") as file:
        for line in file:
            nodes = line.strip().split(" ")
            if len(nodes) != 2:
                continue
            graph.add_edge(nodes[0], nodes[1])
    return graph


def get_top_nodes_by_degree(graph: Graph, num: int) -> list[str]:
    return sorted(graph.get_nodes(), key=lambda x: graph.get_neighbors_count(x), reverse=True)[:num]


vote_result = []


def get_top_nodes_by_vote(graph: Graph, num: int = 20) -> list[str]:
    global vote_result
    if len(vote_result) < num:
        vote_result.clear()
        res = []

        # init the vote ability of each node
        vote_ability = {}
        for node in graph.get_nodes():
            # the vote ability of each node is 1
            vote_ability[node] = 1

        # calc the supress factor
        k = 1/graph.get_everage_degree()

        # init the vote score of each node
        vote_score = {}
        for node in graph.get_nodes():
            vote_score[node] = 0
            for neighbor in graph.get_neighbors(node):
                vote_score[node] += vote_ability[neighbor]

        # select the top num nodes, update vote ability and vote score
        for i in tqdm(range(num), desc="Selecting top nodes by vote"):
            if len(vote_score) == 0:
                break
            top_node = max(vote_score, key=vote_score.get)
            res.append(top_node)
            vote_score.pop(top_node)

            # update neighbors' vote score
            for neighbor in graph.get_neighbors(top_node):
                if neighbor in vote_score:
                    vote_score[neighbor] -= vote_ability[top_node]
            vote_ability[top_node] = 0
            for neighbor in graph.get_neighbors(top_node):
                max_supress = max(-vote_ability[neighbor], -k)
                vote_ability[neighbor] += max_supress
                for neighbor_neighbor in graph.get_neighbors(neighbor):
                    if neighbor_neighbor in vote_score:
                        vote_score[neighbor_neighbor] += max_supress

        vote_result = res
    return vote_result[:num]


def sir_simulation(graph: Graph, infected_nodes: list[str], beta: float, gamma: float = 1) -> int:
    # init the set of susceptible nodes, infected nodes and recovered nodes
    susceptible_nodes = set(graph.get_nodes())
    infected_nodes = set(infected_nodes)
    recovered_nodes = set()

    # remove the infected nodes from the susceptible nodes
    for node in infected_nodes:
        susceptible_nodes.remove(node)

    # simulation
    flag = True
    while flag:
        flag = False
        new_infected_nodes = set()
        new_recovered_nodes = set()
        for node in infected_nodes:
            # spread the virus
            for neighbor in graph.get_neighbors(node):
                if neighbor in susceptible_nodes and random.uniform(0, 1) < beta:
                    flag = True
                    new_infected_nodes.add(neighbor)
                    susceptible_nodes.remove(neighbor)

            # recover from the virus
            if random.uniform(0, 1) < gamma:
                new_recovered_nodes.add(node)
                flag = True

        # update the status of nodes
        infected_nodes.update(new_infected_nodes)
        infected_nodes.difference_update(new_recovered_nodes)
        recovered_nodes.update(new_recovered_nodes)

    return len(recovered_nodes) + len(infected_nodes)


def run_simulation(graph, top_nodes_by_degree, top_nodes_by_vote, beta, top_nodenum):
    sum_infe = 0
    sum_vote = 0

    infe_results = []
    vote_results = []
    for _ in range(9):
        infe_results.append(sir_simulation(
            graph, top_nodes_by_degree, beta=beta))
        vote_results.append(sir_simulation(
            graph, top_nodes_by_vote, beta=beta))

    median_infe = sorted(infe_results)[len(infe_results) // 2]
    median_vote = sorted(vote_results)[len(vote_results) // 2]

    return top_nodenum, beta, (median_infe, median_vote)


if __name__ == "__main__":
    graph = get_graph("./twitter_combined.txt")
    print("Nodes count: ", graph.get_nodes_count())
    print("Edges count: ", graph.get_egde_count())

    # Define the range of values for top_nodenum and beta
    top_nodenum_values = [1, 3, 5, 10, 20]
    beta_values = [0.001, 0.002, 0.005, 0.01,
                   0.02, 0.03, 0.02, 0.05, 0.08, 0.1]

    results = []
    get_top_nodes_by_vote(graph)

    with ThreadPoolExecutor() as executor:
        futures = []
        for top_nodenum in tqdm(top_nodenum_values, desc="Top Node Num Loop"):
            for beta in tqdm(beta_values, desc="Beta Loop", leave=False):
                top_nodes_by_degree = get_top_nodes_by_degree(
                    graph, top_nodenum)
                top_nodes_by_vote = get_top_nodes_by_vote(graph, top_nodenum)
                futures.append(executor.submit(
                    run_simulation, graph, top_nodes_by_degree, top_nodes_by_vote, beta, top_nodenum))

        for future in tqdm(as_completed(futures), total=len(futures), desc="Simulation Progress"):
            top_nodenum, beta, (infected_nodes_by_degree,
                                infected_nodes_by_vote) = future.result()
            result = {
                "top_nodenum": top_nodenum,
                "beta": beta,
                "infected_nodes_by_degree": infected_nodes_by_degree,
                "infected_nodes_by_vote": infected_nodes_by_vote
            }
            results.append(result)

    # Save the results to a file
    with open("simulation_results.json", "w") as file:
        json.dump(results, file, indent=4)

    print("Results saved to simulation_results.json")